


This guide explains the functionalities available in the Clearnet client area as shown in Screenshot:
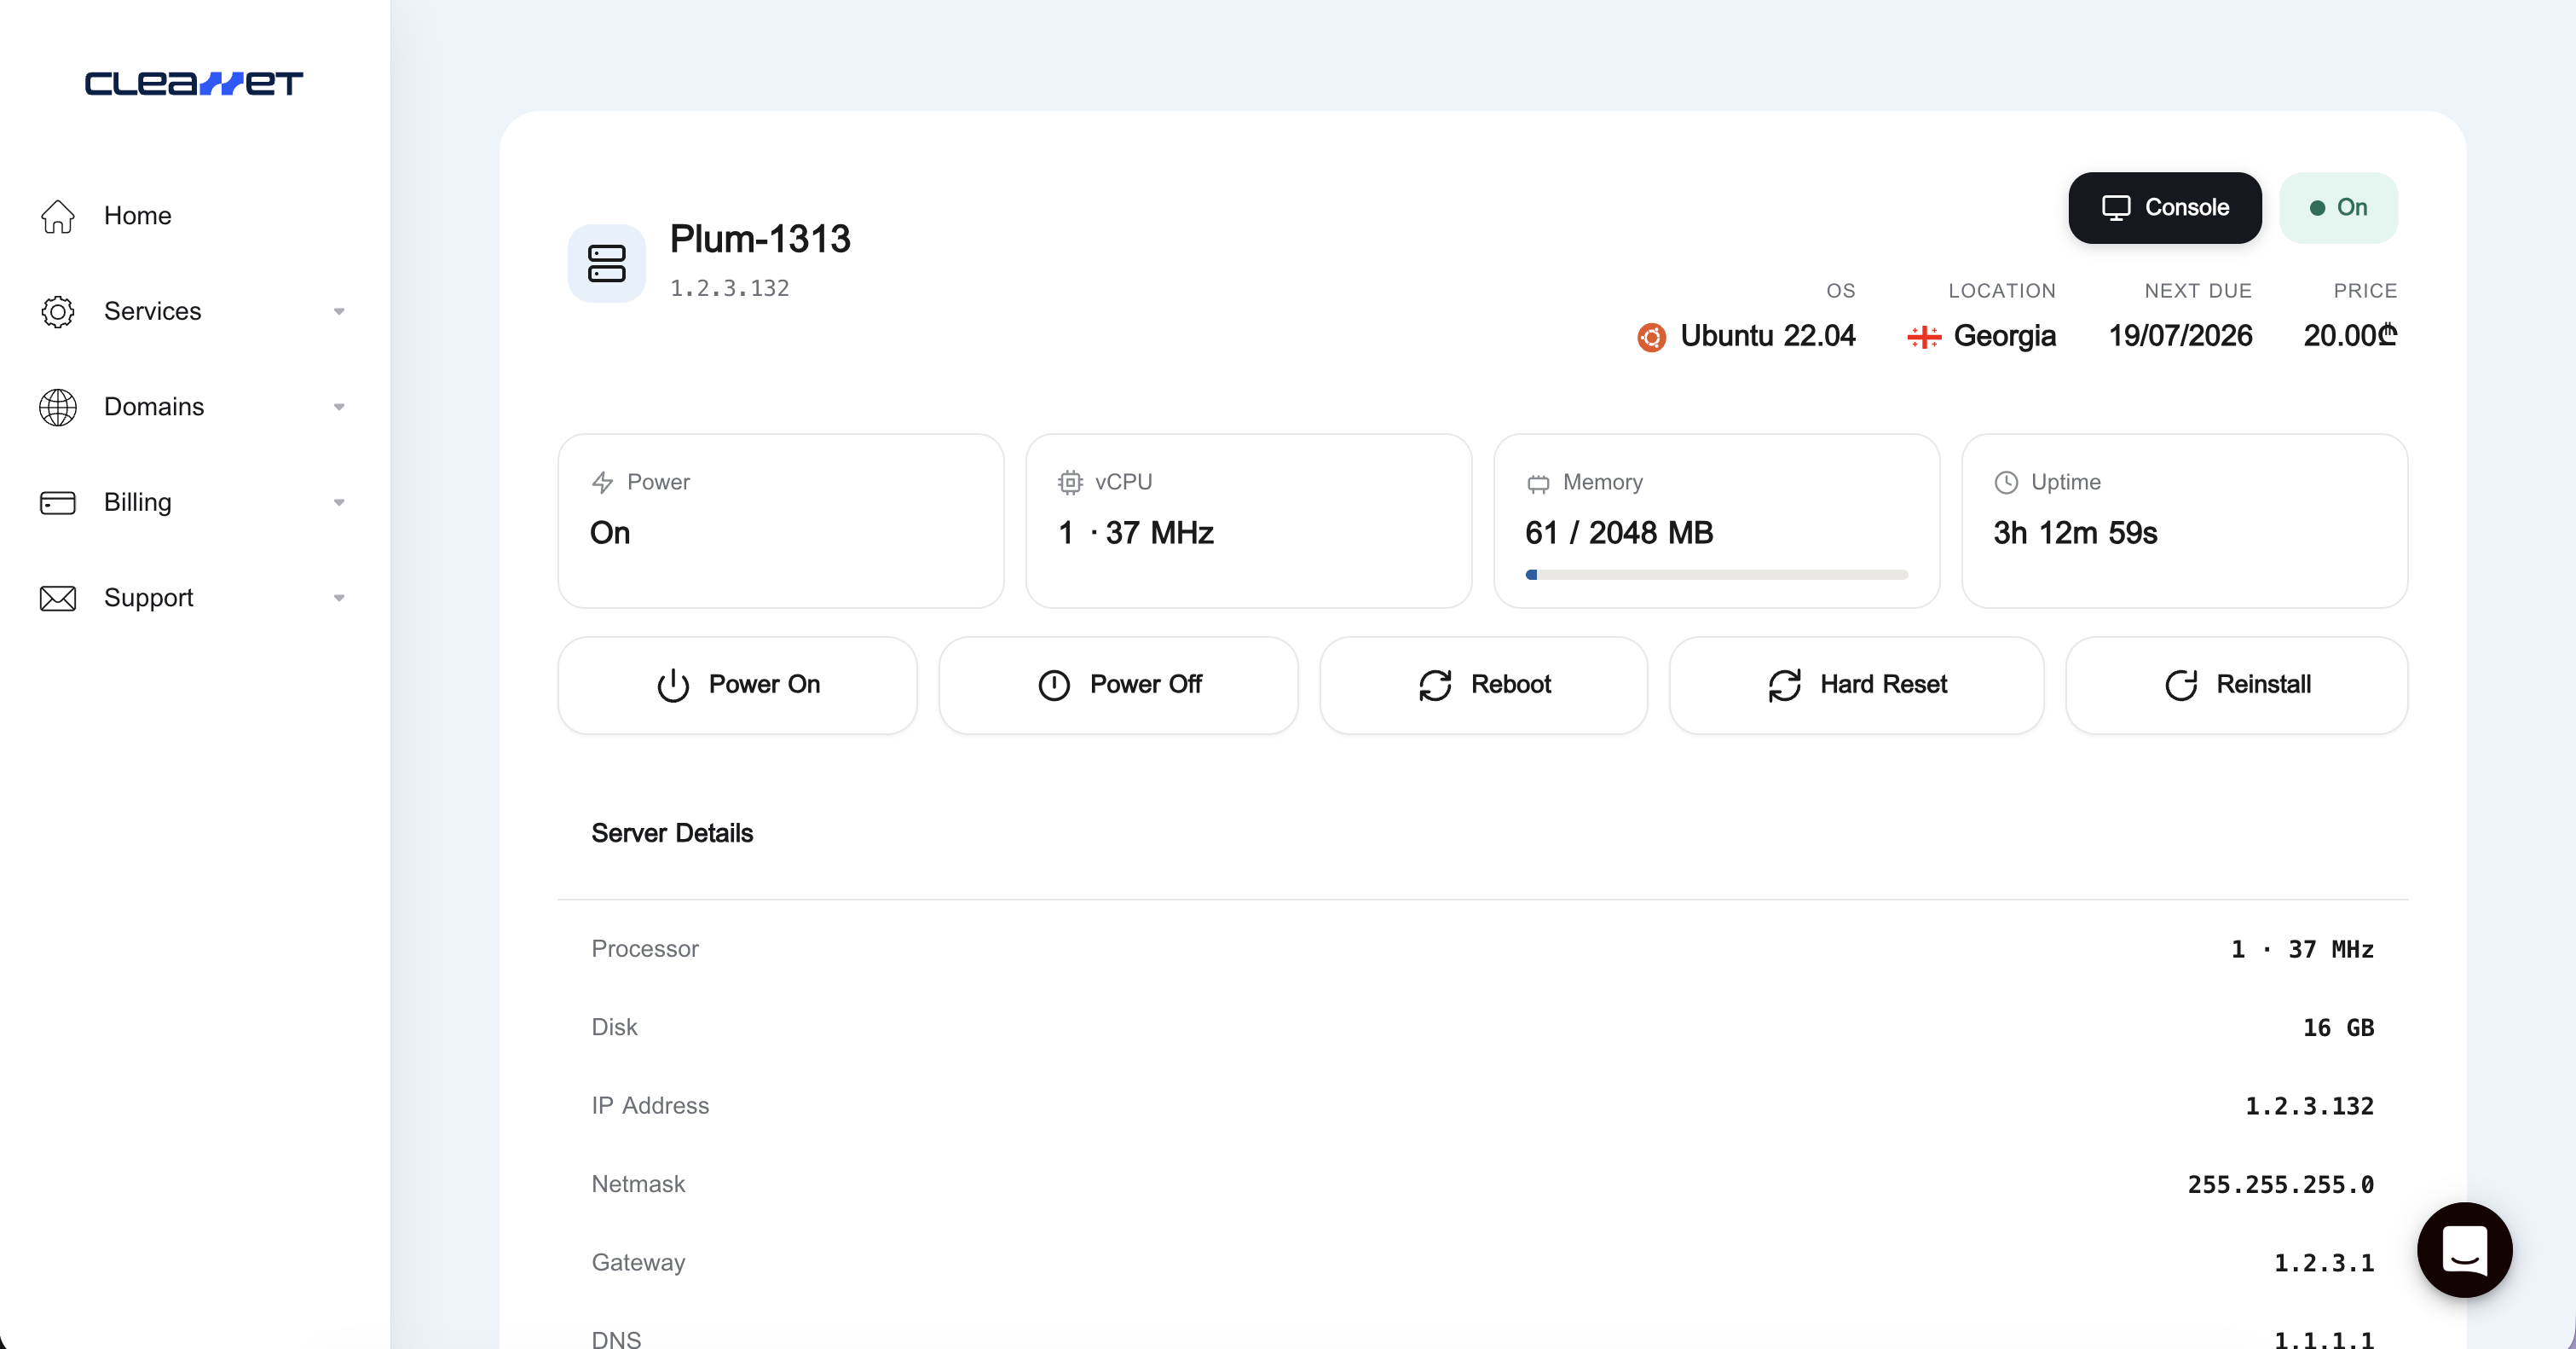
1. Real-Time Server Metrics
At the top of your dashboard, you can monitor your server's live resource allocation:
- Power / Status: Displays whether your virtual instance is actively running (
On) or stopped. - vCPU: Shows your assigned processor cores and current clock speed usage.
- Memory: Displays active RAM utilization out of your total package limit (e.g., 61 / 2048 MB).
- Uptime: Tracks exactly how long your server has been running continuously since its last boot sequence.
2. Power Management and Control Actions
The central control row features five critical operations for administering your VPS environment:
- Power On: Starts up your virtual machine if it is currently powered down or stopped.
- Power Off: Initiates a graceful ACPI shutdown. This safely closes all open database connections, saves configuration files, and gracefully shuts down the Operating System.
- Reboot: Performs a standard software-level soft restart. This is the recommended way to restart your system after updating packages or changing configurations.
- Hard Reset: A forced hardware-level power cycle. Use this action only if your server is completely frozen, locked up, or unresponsive to SSH and standard reboot commands. It immediately cuts and restores power, simulating pulling a physical power cord.
⚠️ Critical Caution: The Hard Reset task executes immediately. Avoid clicking this button multiple times in rapid succession. Continuously forcing power cycles on an active server can corrupt the file system and severely damage your virtual instance.
- Reinstall: Wipes the server's primary storage drive completely clean and deploys a fresh image of your chosen Operating System.
⚠️ Warning: This action is entirely destructive. Executing a reinstall permanently deletes all data, databases, and custom configurations on the drive.
🔍 Monitoring Reboots, Resets, and Reinstalls via Console
Whenever you execute a Reboot, Hard Reset, or Reinstall, the server needs time to initialize its hardware and load services. You should never guess what is happening in the background.
Instead, look at the top right of the panel next to your power status—you will see a Console button. Click this to open a live visual feed of your server's monitor. This allows you to track the boot progress in real-time, diagnose boot loops, and watch the OS installation process unfold.
3. Network and Server Specifications (Provisioning Details)
The Server Details table beneath the control module displays your core networking parameters:
- Processor & Disk: Confirms your allocated hardware resources (e.g., 1 Core, 16 GB Disk).
- IP Address: Your unique public identifier used to access the server via SSH, SFTP, or web browsers.
- Netmask & Gateway: Critical routing configurations that manage how data packets enter and exit your host network environment.
- DNS: The primary Domain Name System resolver assigned to your server for internet name resolution.
💡 When to use these details: Keep these network values handy. When executing a fresh OS Reinstallation, or if you are manually configuring a custom OS setup, you will need to re-enter this static IP Address, Netmask, Gateway, and DNS into your network configuration files to re-establish your internet connectivity.